I was tempted by the following data set, which relates both to my home city of Cork, and my interest in the Arts: the Cork City Council Libraries Key Metrics which was found on Ireland’s Open Data Portal at data.gov.ie, which had been released on January 25th 2021 with data for the years 2018-2020, and was updated on March 1st to include the years 2015-2017. This is how the data set looked:
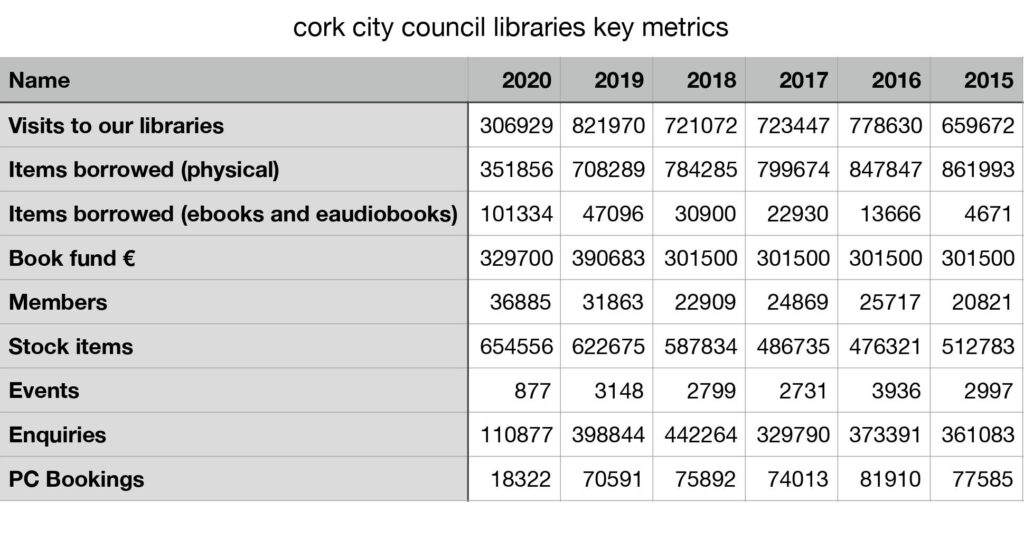
Three significant notes accompanied the data set:
- Up until 30 May 2019, Cork City Council Libraries consisted of seven library locations. Following boundary revision on 31 May 2019, Cork City Council Libraries now comprises ten library locations 1
- Douglas Library was closed following fire between 1 September 2019 and 17 December 2020 2
- PC bookings were suspended on 10 March 2020 due to coronavirus pandemic.
Firstly I renamed the following categories, for legibility: Visits to our libraries became Visitor Numbers; items borrowed (physical) became Physical Items; items borrowed (ebooks and audiobooks) became E-Items. I reordered the columns on the table so that the years read 2015-2020 as we read left to right. Then I removed the ‘Stock Items’ and ‘Book Fund €’ categories, as I would not be concerned with them for this project. I inputted the set into Flourish, and created the line graph below:

The first thing that struck me looking at the graph was the effect that Covid-19 had on Visitor Numbers. I was also interested in the correlation between that and Enquiries.
What I can surmise from the graph above is:
- Covid-19 in 2020 had a devastating effect on Visitor Numbers – a drop of well over half from the high of 2019. However, learning of the conditions under which the libraries were operating, I am surprised that the libraries still managed to attract the numbers they did. The libraries managed to remain open for almost 7 months during 2020, but even during these months (from March on), they had to restrict visitor numbers. I would imagine that a further consequence for the libraries was one they shared with other enclosed spaces: the reluctance of visitors to enter them, and furthermore to even touch the books and other physical items. It was through the admirable introductions of systems like the call-and-collect 3, and the quarantining of books 4, that the libraries managed to provide a base level service that I would imagine members acknowledged and appreciated over the course of the year, and began to avail of, as their confidence grew.
- On a more general note over the years, Enquiries are related to Visitor Numbers – numerically and graphically they make ‘fine bedfellows’. Enquiries are any question a visitor wants to make to a member of staff: it can be about a book at the desk, it can be help with locating a magazine article on the computer, a question relating to opening hours, and it can even be a phone call or email. It is obvious that not every visitor makes an enquiry, some visitors know what they want and how to get it, or are content to browse; and certainly not every enquiry has to be related to a physical visitor in the building, but I like the correlation between them.
- It is curious, while we look at it, that Enquiries didn’t increase in 2019 with the addition of the 3 libraries. In 2018 however, there was an increased emphasis on members to ‘self-service’ 5 – where members can borrow a book without ever approaching the desk, or interacting with any staff. I would speculate that the reason for the increase in enquiries in 2018 was due to members of the 4 ‘new’ libraries approaching the desk or staff to receive guidance on how to use the new Self-service Kiosk system – and this need for assistance would have decreased the next year. In other words, there is a relatively new policy of encouraging ‘self sufficiency’ amongst the members – and that this self sufficiency displays itself in reduced interaction with the staff, and therefore enquiries.
The next aspect I wanted to look at was items borrowed from the libraries. Physical items would include books, magazines, CDs, DVDs etc.; whereas E-Items included downloaded e-books (an e-book can be downloaded only to one person), audiobooks and other E-services.6 I created a bar graph to appreciate the discrepancy in scale between the two catagories:
This graph is interesting for a number of reasons. It tells a story simply yet effectively. There is the obvious, expected severe drop in Physical Items borrowed in 2020 compared to 2019, and there is a doubling of E-items borrowed in the same time period.
However, looking at the bars as we progress year to year, it shows a deeper picture – almost a roadmap of the future. The amount of physical items borrowed has been steadily declining for years, despite the addition of the new libraries in 2019. There is a corresponding unfaltering rise in E-items borrowed since the infancy days in 2015. The contrast between the years 2o15 and 2019 is telling – and this before the consequences of the pandemic. The advantages bestowed by the BorrowBox system 7 has made online borrowing a couple-of-clicks process, and would have continued to convert users, despite the pandemic. Covid-19 did accelerate the process, but I feel this trend is a harbinger of a future where the foundations were laid years ago. There is going to come a time when the numbers for Physical Items and E-items will match, and if trends continue the way they are going, then the one will overtake the other within a decade.
Next, I wanted to look at members, and examine the trend over the years. Looking at the Members graph on the left hand side below, we can see that member numbers have risen dramatically over the last couple of years. As we know however, there was a change in the city boundaries in 2019 that led to the addition of 3 new libraries. I learned from my interviews with Ann Riordan 8 that the addition of the new libraries accounted for approximately 8,800 new members. So I reordered 8,800 members in the 2019-2020 numbers, to create the graph on the right, below:
I would imagine that in this graph (Reordered Members) the purple area is more representative of the ‘true’ trend of member numbers over the years. While the trend is not as spectacular as in Total Members, there is still a reassuring rise in member numbers for 2020 (despite only a tiny increase in 2019). I would speculate that this rise was generated by conditions imposed by the pandemic: people became members to enable online borrowing. This increase in online interest, I would imagine, was a direct result of the twin factors of library closure, and also the reluctance to enter library spaces when they were open. However, if we look at the years up to 2019, then membership would have only shown a significant increase in the year 2016, before dropping down again for 2017.
This is a interesting pattern that I noticed replicated in other catagories: something happened in 2016 that increased numbers in that year relative to the other years surrounding it.
Thinking about it, I realised that the question may not so much be what happened in 2016, but rather what happened a hundred years before that, in 1916? The 1916 centenary initiated many cultural events across the country, and Cork City Libraries celebrated in its turn this seminal moment with many events that utilised their spaces and reached outwards into the communities. So it comes as no surprise that 2016 would show significantly to other years, especially in Events, and I would speculate that these events had a direct influence on the other categories outlined in the graphs.
So, what does all of this mean? What does this data set and these graphs tell us about the story of the Cork City Libraries and their journey onwards through the years? I see the increasing emphasis on the Self service Kiosk system, in parallel with the utilisation of BorrowBox, as a consequence of the digital age we all live in. This can have major benefits in several areas: the freeing up of staff to perform other duties, particularly staff manning the desks. But what does it mean for the libraries - the spaces - themselves? The Digital Age has brought many concerns for the GLAMs, not least how they are to survive if their physical space seems to be in any way redundant. If we can borrow online and read at home, and if we order online and collect our order at an unmanned desk, will the need for the spaces decrease? If the spaces are not fulfilling a major function of their presence - the interaction, the hub of community, the comfort of being in a space where we can take an hour to read a good book, will the thought occur to cash-strapped councils: "We actually don't need this expensive building at all" ? The next decade will, like all good books, surely tell a tale.
Acknowledgments:
I would like to express my thanks to Ann Riordan, Librarian, whose willingness to give her time for interviews over Zoom is very much appreciated.
I would also like to thank Sinéad Donnelly for providing valuable information that I used when first exploring the data set.
Bibliography:
Central Statistics Office. “Data.Gov.Ie.” Accessed March 5, 2021. https://data.gov.ie/.
Cork City Council. “Cork City Council Libraries Key Metrics - Data.Gov.Ie.” Accessed March 5, 2021. https://data.gov.ie/dataset/cork-city-council-libraries-key-metrics.
Cork City Libraries. “Home.” Cork City Libraries. Accessed March 11, 2021. https:/www.corkcitylibraries.ie/corkcitylibraries/en/.
Gov.ie. “Creative Ireland.” Creative Ireland Programme. Accessed March 12, 2021. https://www.creativeireland.gov.ie/en/about/.
Meeks, Elijah. “2019 Was the Year Data Visualization Hit the Mainstream.” Medium, December 30, 2019. https://medium.com/nightingale/2019-was-the-year-data-visualization-hit-the-mainstream-d97685856ec.
- Therefore members from the additional 3 libraries were added to the total membership for 2019 and onwards
- Douglas was one of the three ‘new’ libraries; therefore for the purposes of this data set, Douglas Library was operational only for June, July and August 2019
- Members ordered online/by phone, collected the orders from a staff member in a foyer, and ‘dropped’ the returns back to a box
- Books were put in storage for four days before being allowed back into circulation for borrowing
- The Self-service Kiosk was introduced in 2015 in 3 city libraries, and added to in 4 more libraries in 2018. It enables members to borrow/return physical items and to print documents without the need to ask staff for assistance
- This also includes E-magazines, E-Newspapers, E-Learning Courses and E-Learning.
- An application suitable for multiple devices, designed to enable easy e-borrowing
- A Librarian in Cork City Libraries, and my main contact and source of information as regards clarification of elements of the data set